Usage metrics
The usage metrics tab is a dashboard, within the Concentric admin application, showing Concentric usage data at the healthcare organisation. This page aims to guide admin users who are interacting with the usage metrics tap – generally the project team and clinical leads – through the various views available.
Dashboard structure
Within the ‘Usage metrics’ tab is a view that has a specialty and date filter at the top, followed by 6 clickable sub-tabs such as ‘Recent usage’ and ‘Trends’:
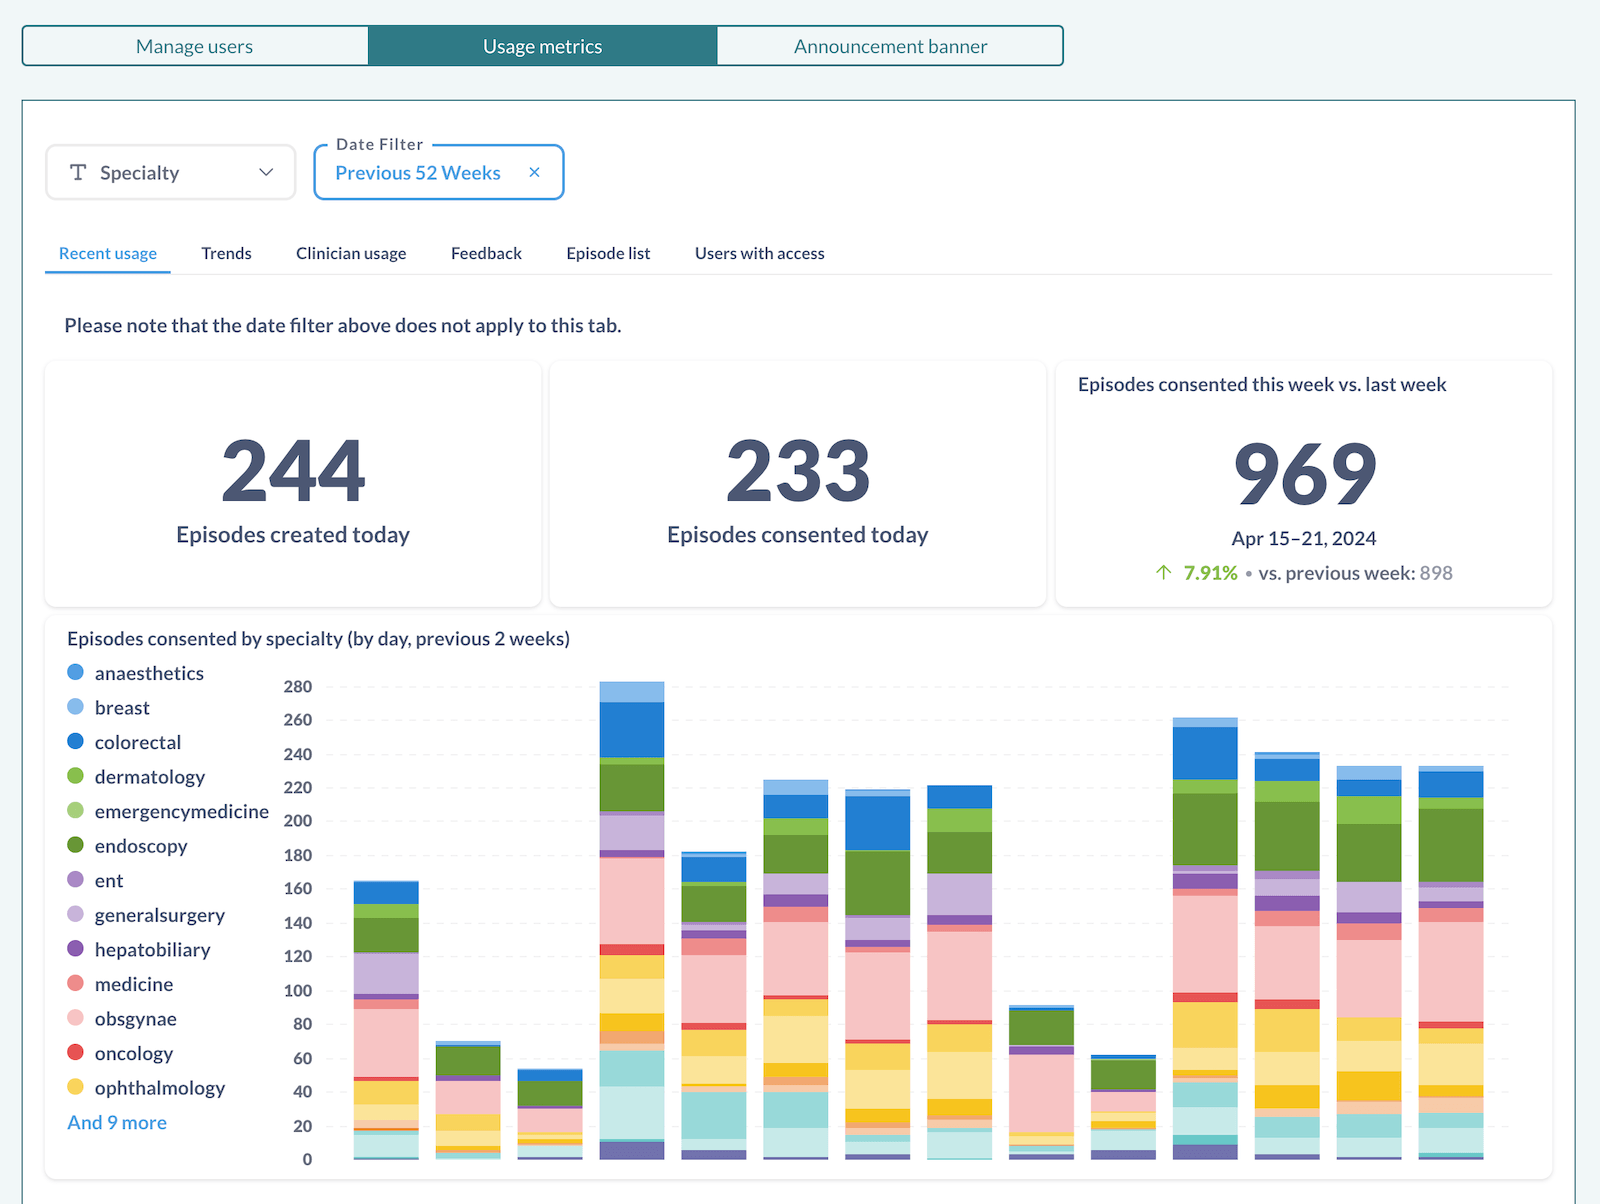
The date filter defaults to the previous 52 weeks but this can be modified as desired by clicking on the date filter.
Within many of the sub-tabs there is some guidance text – such as ‘Please note that the date filter…’ in the above image – relating to either the use of filters or how often the data is updated (some of the data is live and other graphs and tables are updated daily or weekly, as per the guidance text).
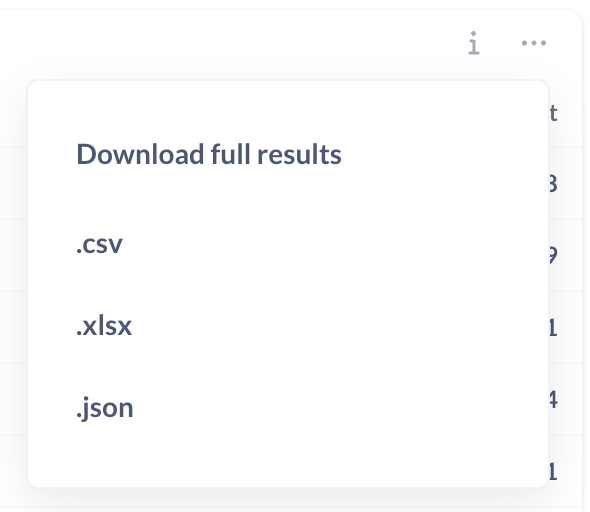
In the top right corner of each dashboard element is an option to download the data in a choice of format, and in some case some additional context regarding the element. Hover over the relevant dashboard element to reveal a ‘3 dots’ icon, and an ‘i’ icon if there is additional context. Click the 3 dots for options regarding downloading full results, or hover over the ‘i’ to reveal the additional information:
For any chart that is broken down by specialty, hovering over a specialty on the left/top of the graph will highlight that specialty across the chart. Hovering over the bar within the graph shows a numerical breakdown, by specialty, for the selected bar.
Where a table has multiple columns, the table can be sorted by any of these columns by clicking on the column heading.
Usage of Concentric within test patient records is excluded, with the exception of the ‘Clinicians with test patient interaction only’ table in the ‘Clinican usage’ sub-tab.
Recent usage
The ‘Recent usage’ sub-tab shares a live snapshot of the latest activity in Concentric and can be used by project teams to assess usage on a day-by-day basis, and change in use compared to the previous week. For example:
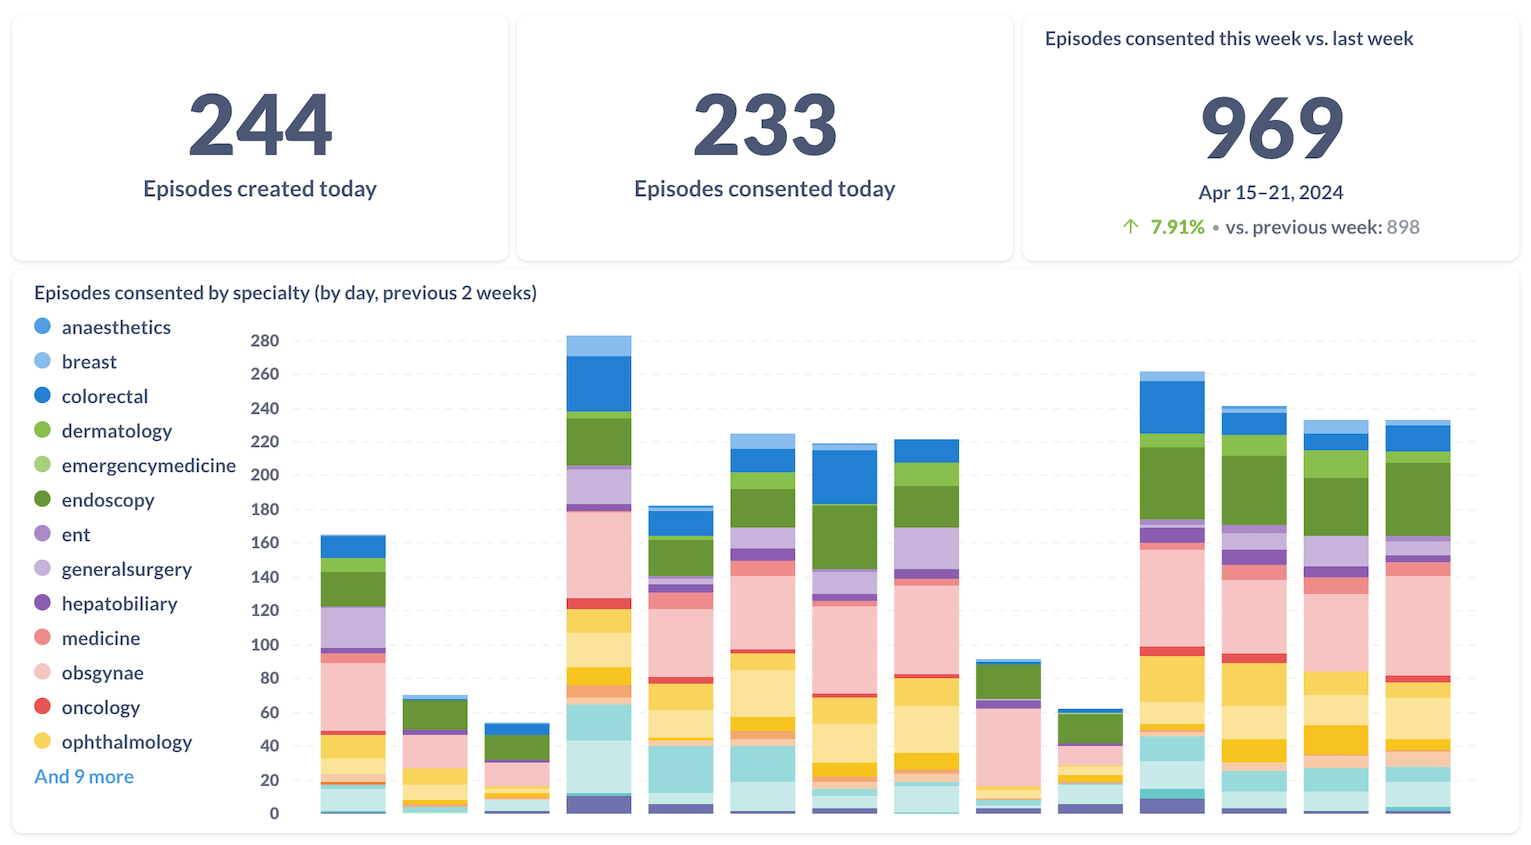
Episodes created today: A count of the number of consent episodes created since midnight.
Episodes consented today: A count of the number of consent episodes for which the patient has given consent since midnight. ‘Confirmation of consent’ events are not included within this number.
Episodes consented this week vs. last week: A count of the number of consent episodes for which the patient has given consent this week. The percentage below the main number shows how this number compares to the same time point in the previous week.
Episodes consented by specialty (by day, previous 2 weeks): This chart shows the number of episodes consented by day over the past 2 weeks, where each bar represents a day. Hovering over a day shows a numerical breakdown, by specialty, of the episodes consented that day.
Trends
The ‘Trends’ sub-tab shows information about use of Concentric over time, updated weekly at the end of each week (at 23:59 each Sunday, meaning that date ranges filters including the current week will not be accurate), within the specified date range. For example:
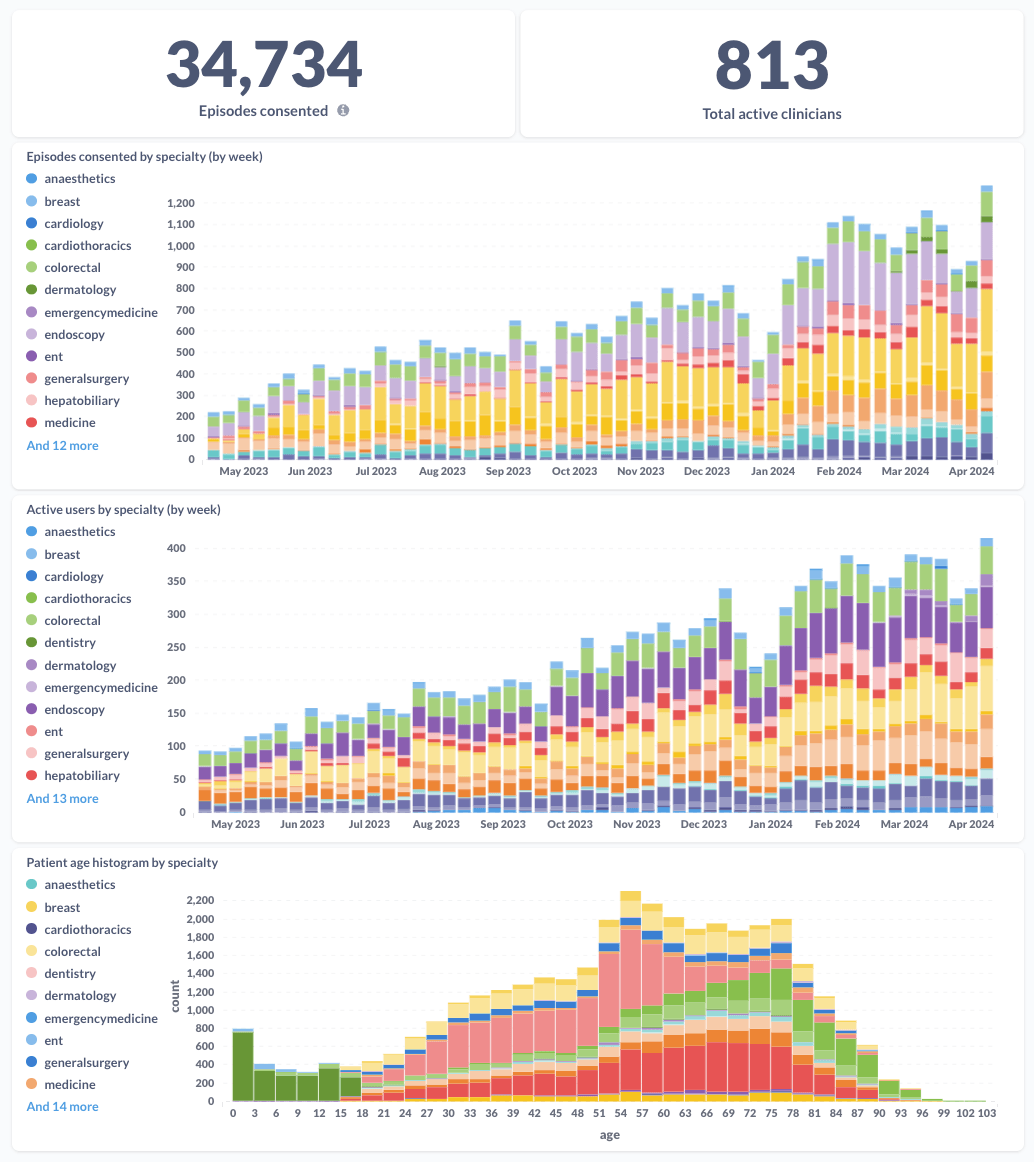
Episodes consented: A count of the number of consent episodes for which a patient has given their consent.
Total active clinicians: An active clinician is a clinician who has created, modified and/or shared a consent episode – this number therefore does not include clinicians who have logged in but not interacted with a real patient record, or those with a read-only account.
Episodes consented by specialty (by week): This chart shows the number of episodes consented by week, where each bar represents a week.
Active users by specialty (by week): This chart shows the number of active clinicians per week, where each bar represents a week. The trend of this chart often looks similar to the above episodes consented by specialty chart.
Patient age histogram by specialty: This chart shows the age distribution of patients who have given consent via Concentric, by specialty, over the selected date range, represented as a histogram. Each bar corresponds to a 3 year age range (for example the ‘54’ bar includes patients aged 54, 55, and 56).
Clinician usage
The ‘Clinician usage’ sub-tab shows information about which clinicians have been using Concentric, or trying out Concentric initially with a test patient record, within the specified date range.
Clinicians with usage: This table shares information about the clinicians that have interacted with consent episodes. For each clinician, the following info is displayed: name, job title, number of episodes created/consented, number of episodes as responsible clinician, date of last interaction, and account information (responsible clinician status, specialty, and email address).
The blue bars in the numerical columns are a visual representation representation of that clinician’s count compared wth the highest number of any clinician for that column:
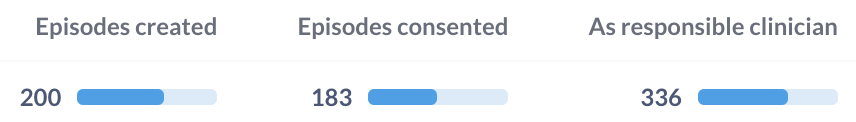
Note: When filtering by specialty the counts reflect the episodes associated with that specialty (i.e. where the episode is associated to a responsible clinician of that specialty), but all user accounts are kept within the table. To view/export a list of users by associated specialty this can be done via the ‘Users with access’ sub-tab.
Clinicians with test patient interaction only: This is a list of clinicians who have interacted with episodes only within test patient records, details of which are shared within the getting started guide. Note: The specialty filter does not apply to this list.
Tip: This list can reveal a useful group of clinicians to reach out to during a Concentric deployment with the offer of supporting the next step of using Concentric with real patients.
Most used treatment templates: This list, mostly out of interest, shows how many times each treatment templates has been used in Concentric. The date filter does not apply to this list (i.e. it’s an ‘all-time’ list) and each component of a combined procedure is counted individually.
Feedback
This sub-tab, including only the In-app patient feedback table, shares the feedback received within the Concentric patient application, in the selected date range. This does not include feedback received via other channels, such as the post-consent survey email.
For each patient feedback received feedback itself is shown, alongside the date received, patient age, responsible clinician and clinician receiving consent for the relevant consent episode, and the treatment name.
Episode list
The ‘Episode list’ sub-tab contains two tables, one sharing a list of consented episodes, and another sharing a list of consent form 4 epiosdes (i.e. where treatment decisions are being made in an adult patient’s best interest due to the patient lacking capacity to make the decision themselves).
Consented episodes list: A list of consent episodes for which the patient has given consent in the selected date range. For each consented episode, the following are displayed: date consent episode created, date consent given, hospital number, NHS number, name and job title of clinician receiving consent, name and job title (and GMC number if provided) of responsible clinician, specialty, treatment name, and whether consent has subsequently been revoked.
Note: This is not a list of all episodes within Concentric as episodes where consent has not been given (for example they are in draft status or awaiting remote consent) are not shown in this list.
Consent form 4 episodes: A list of consent episodes where a consent form 4 has been used to gain consent in the selected date range. For each episode, the following are displayed: date consent recorded, hospital number, responsible clinician name, specialty, and treatment name.
Tip: Safeguarding teams often appreciate knowledge of, and access to, this list as it can support their work in quality assurance of the Consent Form 4 processes.
Users with access
This sub-tab, including only the Users with access table, shared the list of all users who have access to Concentric. Disabled users are not included and the date filter does not apply to this list (i.e. it is a list of users with current access).
For each user, the following are displayed: first name and surname, job title and specialty, whether they are assigned as a responsible clinician, whether the account is a read-only account or has admin privilidges, when the user last logged in to Concentric, and the email address associated with the account.
Tip: This list is the easiest way to access the contact details of Concentric users for purposes of group communications. Details can be exported (see the dashboard structure section above for guidance) and further filtered if necessary.
Support and feedback
We hope that the above is a useful guide to exploring Concentric usage data at your organisation. The data currently presented on these dashboards has been driven by the needs of admin users at deploying organisation and we continue to be responsive to the needs of admin users with regards to what is presented on the dashboards – if there are improvements you would like us to consider please contact us, we are happy to explore these.